csvbase is a simple website for sharing table data. Join the discord.
Take the tools out of 'Data', but don't take the data out of the tools

Using dataframes to write smaller, faster programs
2023-01-11
by Cal Paterson
The Data team are using a strange and weird datastructure: the dataframe. Dataframes are different to the usual nested hashtables and arrays. They are optimised for bulk operations - those are the operations you tend to do when analysing data.
When you write code with objects they call it "object-oriented programming". I think when you code with dataframes they should probably call it "dataframe-oriented programming". For whatever reason they tend to call it "data science" instead.
Worked examples of "dataframe-oriented programming"
Programming with dataframes is probably best illustrated by worked example.
Here's a sample problem:
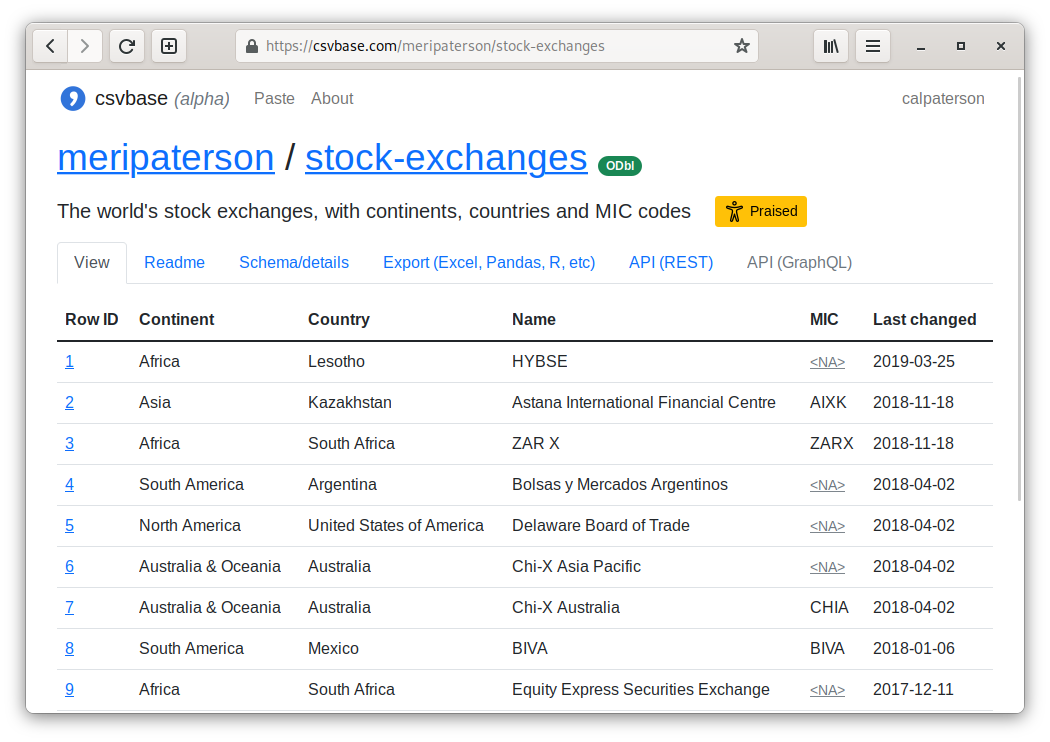
Starting from some published data about stock exchanges (meripaterson/stock-exchanges), print an alphabetically sorted list of "MIC codes".
MIC codes are a bit
like airport codes but for stock exchanges (in fact: for any kind of "trading
venue"). Instead of "LHR" referring to Heathrow, the London Stock Exchange
is referred to by "XLON". Of course, some stock exchanges in the published
dataset don't have a MIC code entered. Not all stock exchanges have been
assigned one. These "blanks" will need to be removed.
Here's how you do it with pandas, which is probably the most widespread dataframe library:
#!/usr/bin/env python3
from sys import stdout

# 'pip install pandas' first
import pandas as pd

df = (
    # read csv from csvbase
    pd.read_csv(
        # csvbase does HTTP content negotiation to allow pandas to use the same
        # url as a browser - magic!
        "https://csvbase.com/meripaterson/stock-exchanges",
        # and restrict to just the 'MIC' column
        usecols=["MIC"]
    )
    # drop nulls
    .dropna()
    # sort
    .sort_values("MIC")
)

# write to stdout (as a single column csv with no header)
df.to_csv(stdout, index=False, header=False)
That looks a bit different to how you might usually do it in Python.
There are no for-loops or no if statements: it's all whole-dataframe operations. Those are more efficient and that matters more as the dataframe grows. It's also more readable, once you're used to the change in style.
Some will have experience programming this way when using SQL queries. Here's how you could do the same thing with SQL:
#!/usr/bin/env sh
curl -s https://csvbase.com/meripaterson/stock-exchanges \
    | sqlite3 -csv ':memory:' '.import /dev/stdin t' \
              "SELECT MIC FROM t WHERE MIC != '' ORDER BY MIC ASC"
SQL comes out pretty terse for this problem and in fact sqlite makes a decent
dataframe library. Again: no for loops or if statements: SQL doesn't even have
a for-loop in the language and the "if statement" (CASE) doesn't allow you to
control program flow. The tricky part with SQL is that, because the language
isn't easily composable (notoriously, people just concat text strings),
complicated queries can balloon out in size as the problem grows.
Another dataframe library: Apache Spark. Spark acts as a dataframe API on top of Hadoop. Hadoop has a (well deserved) reputation for Cthulhu-tier complexity but using Apache Spark is actually not too much harder than using Pandas:
#!/usr/bin/env python3
from sys import stdout
import csv

# 'pip install pyspark' for these
from pyspark import SparkFiles
from pyspark.sql import SparkSession

# make a spark "session".  this creates a local hadoop cluster by default (!)
spark = SparkSession.builder.getOrCreate()
# put the input file in the cluster's filesystem:
spark.sparkContext.addFile("https://csvbase.com/meripaterson/stock-exchanges.csv")
# the following is much like for pandas
df = (
    spark.read.csv(f"file://{SparkFiles.get('stock-exchanges.csv')}", header=True)
    .select("MIC")
    .na.drop()
    .sort("MIC")
)
# pyspark has no easy way to write csv to stdout - use python's csv lib
csv.writer(stdout).writerows(df.collect())
Helpfully, the python spark libraries will start up your own personal hadoop cluster by default. That makes getting rolling much easier. Admittedly, there is more noise in this version - but most of that is setup and you can still see the dataframe operations clearly in the middle of the program. Again: no loops, no ifs.
Just one more, in R:
#!/usr/bin/env Rscript
mics <- read.csv('https://csvbase.com/meripaterson/stock-exchanges')["MIC"]
non_nulls <- sort(mics[!apply(mics == "", 1, all),])
write.table(non_nulls, "", quote=F, row.names=FALSE, col.names=FALSE)
R is pretty terse too - and yet again, no ifs, no loops. I'm a bit of a beginner with R so there are probably ways to golf the above program down further (if so: please tell me how).
Dataframes allow the programs which mainly manipulate data to be smaller, quicker to write and easier to follow - that's why the data team like them. It's just a lot easier to read through a (usually short) sequence of whole-dataframe operations than to read some free-flowing imperative code.
The key to legible (and efficent) dataframe code is to leave the data in the dataframe. Use the operations the dataframe library provides to work on the data. Avoid the temptation to rip the data out and operate on it with your programming language's native functions. Operate on the data where it already is!
Dataframes have wider applicability than just data teams, though. I think they should be used more often than they are. In the rest of the article I am going to give some hints on how to get started using dataframes. The hints will be mostly generic across all tools but from now on I'll give code samples for pandas.
Hint 1: Pre-processing matters
One of the fairly bleak realisations that comes when working with data is how much of your time is going to be spent cleaning it and fixing it up before you can actually use it. It's crucial to become good at pre-processing the data.
Reshaping
The first and most important sort of pre-processing is reshaping. People release data in all sorts of weird and wonderful shapes but usually you only want one specific kind of shape: long - as opposed to wide.
Here's an example wide table:
| School | Average mark (2007) | Average mark (2008) | Average mark (2009) |
|---|---|---|---|
| Hogwarts | 74 | 75 | 71 |
| Smeltings | 55 | 65 | 59 |
| St Brutus's Secure Centre for Incurably Criminal Boys | 34 | 40 | 42 |
This layout can be a real pain. Aggregation functions don't work well.
Imagine trying to calculate the average mark across all schools and all years -
you'd have to first stack the all the marks into a single column before you
could take the average by running
mean.
And of course each time a new year of data is added to your dataset you'd have
to go back and correct your stacking code. If you forget to do so, then you
get the wrong answer.
And here's what the same data looks like in "long" format:
| School | Year | Average mark |
|---|---|---|
| Hogwarts | 2007 | 74 |
| Hogwarts | 2008 | 75 |
| Hogwarts | 2009 | 71 |
| Smeltings | 2007 | 55 |
| Smeltings | 2008 | 65 |
| Smeltings | 2009 | 59 |
| St Brutus's Secure Centre for Incurably Criminal Boys | 2007 | 34 |
| St Brutus's Secure Centre for Incurably Criminal Boys | 2008 | 40 |
| St Brutus's Secure Centre for Incurably Criminal Boys | 2009 | 42 |
Now taking the average is easy, it's just potter_schools_long["Average mark"].mean(). Getting the average for a single year is no more difficult,
you just filter out other years first.
What you usually want is for each individual data point to be in it's own row. That just makes life easier. You can, in general, think of a good dataframe as being some "Y" over an "X" - just like X and Y in a graph. Sometimes X can be composite: as in this case, it is (School, Year).
Some other examples of well shaped dataframes:
- bond price (Y) over time (X)
- the emissions of a car (Y) by model and production year (both consitutents of the "X")
- gini index (Y) by country (X)
Simple, X to Y, relationships are the easiest to work with - "long format". The problem is that people keep publishing data in other shapes! How to solve the problem in general?
The solution is a library function that is usually called "melt" (named after
the kind of person who publishes data in wide format). pandas has a
melt
function. melt turns your wide, multiple-Y dataframe into a narrower,
composite-X dataframe. No custom code required.
The converse is often called casting but in pandas is instead called
pivot,
probably taking after Excel, where such a result is called a "pivot table".
Pivot tables aren't useless - sometimes they are handy to find trends, like a
primitive tabular form of graph - but they aren't a good way to store or
exchange data.
When you recieve data that is in a bad shape you should mutter a hex under your breath, reshape with the standard tools from whatever library you're using and move on with you life. Don't write custom code.
Flattening
The next most common issue is that the data you've been given is not tabular in nature. You don't have a CSV, you have some JSON or - christ preserve you - some XML. Such "documents" are pain in the bum because they are fundamentally nested and that doesn't correspond well to our dataframe model.
No bother: you just flatten it. Pandas, for example, has a function called
json_normalize
which takes nested dictionaries (they need not be from JSON) and traverses
them, building a dataframe for you. In other libraries this can be called
"unnesting", splitting or "exploding".
Here's an example which turns some data from the reddit API into a dataframe:
>>> import pandas as pd, requests
>>> r = requests.get("https://www.reddit.com/r/CasualUK/top.json?limit=10&t=year")
>>> # flatten:
>>> top_posts = pd.json_normalize(c["data"] for c in r.json()["data"]["children"])
>>> # parse the unixtimes as datetimes:
>>> top_posts = top_posts.assign(created_utc=pd.to_datetime(
...     top_posts["created_utc"], unit="s", origin="unix"))
>>> top_posts[["author", "created_utc", "upvote_ratio"]]
              author         created_utc  upvote_ratio
0  MellotronSymphony 2022-11-23 08:44:19          0.88
1    Daz-Gregory1337 2022-11-04 09:23:00          0.90
2            Pestish 2022-09-21 16:10:51          0.95
3      f3361eb076bea 2022-08-26 13:42:04          0.93
4              kopsy 2022-10-30 15:29:04          0.84
5    MrClaretandBlue 2022-12-05 09:41:52          0.94
6          going10-1 2022-10-01 10:50:59          0.95
7            zembo12 2022-05-21 07:58:24          0.93
8            vela025 2022-10-22 11:00:24          0.92
9            halosos 2022-05-20 08:16:17          0.88
Sometimes half the battle in programming is knowing what already exists. I have seen people write some substantial pre-processing programs to pointlessly duplicate this common built-in function - they simply did not know it was there for the taking.
Null, NA, "N/A", "", etc — and existential doubt
Another perennial issue is that many there tend to be nulls in data. Null gets written in all sorts weird and wonderful ways, including:
nullNAN/Anot applicable- the empty string
- whitespace
- and many, many more
It's important to catch these when you're loading your dataframe in. Nulls get special treatment in many operations and you want your dataframe library to know that a certain value is a null.
When you read a csv file in pandas, you can tell what nulls look like in advance:
df = pd.read_csv("my-weirdo-data.csv", na_values=["not a bean"])
Don't let the strange and weird textual forms of "no value" propagate through your dataframe program. Convert them when you parse. Then you can get on with the existentially difficult program of working out what a null means in your context (harder than it sounds).
Don't write special code
The most important hint for pre-processing is that you don't should try to
avoid writing special code where you can. You are not the first person who has
had to melt some stupidly wide csv file. You also aren't the first person
who's recieved a file where null is written as N/applicable.
When I was in primary school an art teacher told my class that the children who where the quickest to mix paints became the best painters. Children who were slow to mix each week got progressively less practice than their peers at the painting bit compared to the children who mixed quickly and got on with it.
The same is true of pre-processing: you will have to do a lot of it and it is best that you start seeing melting, casting, flattening, and so on as basic operations that will be provided by your library. Pre-process quickly so you can spend the balance of your time doing data analysis.
Hint 2: Dataframe libraries differ, a bit
Despite the basic concepts remaining the same, dataframe libraries do differ. There is, sadly, no intergalactic standard dataframe API. Not even SQL, which, while notionally portable differs a lot in practice between implementations.
Because dataframe APIs are (mostly) incompatible you need to pick on before you start. Best not discover that your data is too big for memory after having written a long pandas program.
Column-oriented vs row-oriented
Many traditional SQL databases are "row-based", meaning all the data of each row is stored together. That seems obvious and natural but there is another way: "column-based", where you split out each column and keep them all seperate.
Row-based tools have the advantage when it comes to transactional updates: you can more easily lock access to a single row while it's being changed. But data analysis usually doesn't care much about transactions - most data is historical and even if the source data is still being updated most of the time you can just take a "cut" of it and being a day or so out of date is not really a problem.
Column-based tools have many advantages when it comes to reads. Most operations touch on only a subset of columns, and if your columns are stored separately there are fewer bytes to read. That makes it quicker. Columns also tend to compress better when done separately.
Pandas is column oriented, as is Spark and as is R. (Traditional) SQL databases like Postgres and sqlite are not.
Lazy vs strict evaluation
Some dataframes are lazily evaluated: meaning that nothing happens until you ask for the final result. The advantage here is that when the library knows the whole program that will be run that it has more options for optimisation. Often this comes in the form of combining multiple passes over the data into one, but it's a big topic.
Others are strictly evaluated and do each operation, in order, as you issue the instructions. The advantage here is that strict evaluation is easier to understand and debug - reading query plans from lazy dataframe tools is often an art in itself. "My dataframe program is slow" is a much easier problem to resolve when the dataframe is strictly evaluated.
Pandas is strictly evaluated. So is R. Apache Spark and almost all SQL-based systems are lazy.
Single-node vs multi-node
Some dataframe librares are really aimed at running only on a single node. This tends to make them easier to start with and much easier to use for ad hoc analysis: you don't need to first set up some cluster thing and no one is going to ask for your credit card number.
Others are of the big, complicated, distributed, multi-node etc kind. Those scale to much bigger datasets. Usually they are actually slower in straight-line performance than the single-node kind but if your data is big you have no other option.
Pandas, R and sqlite are single-node options. Apache Spark and many of the cloud-hosted services like BigQuery are multi-node. There are of course some options to make single-node dataframe code work transparently across multiple nodes - see Dask.
Hint 3: Speed does matter
A common mantra among software engineers is:
Make it work, make it right, make it fast
This is, in the main, great advice. But it causes grief in data engineering
because the size of data means that slow code can easily be so slow that it
hinders improvement - the n in O(n) is typically a big number. When each
run takes hours (or even days) you are not going to be bold and try to improve
it: management are already highly stressed and keen that nothing interfere with
"the big run".
So I suggest a modified version of the mantra for dataframe-oriented programming:
Make it fast, make it work, make it right
You need at least a little bit of "fast" in order to have the time and space to add more correctness. Projects which have short feedback loops (read results, edit code, run code) will, over time, tend to end up more developed and sophisticated. Projects with long feedback loops become fraught - and people avoid making any changes to them.
My hints, then, for speeding it up:
No loops
The first and most important tip when writing dataframe code is never to try to loop over it.
Looping is generally a disaster for performance. For example, Pandas is intentionally built upon numpy arrays - a datastructure designed for efficiency and vectorisation. When you iterate over them in a Python loop, you throw those advantages away and instead operate at the speed of Python, which...is less than stellar.
Here's a simple example using Pandas:
import timeit
import pandas as pd
import numpy as np

def pd_add_one(df):
    df["a"] += 1

def python_add_one(df):
    for index, row in df.iterrows():
        df.loc[index] = row[0] + 1

df = pd.DataFrame({"a": np.random.rand(1000)})

print("python takes: %f secs" % timeit.timeit(
    "python_add_one(df)", globals=globals(), number=100))
print("pandas takes: %f secs" % timeit.timeit(
    "pd_add_one(df)", globals=globals(), number=100))
On my machine, this program prints:
python takes: 4.007588 secs
pandas takes: 0.007870 secs
Looping in this case is around 500 times slower. The example might seem artificially constructed to favour pandas by deliberately using a simple operation (addition) but actually it's heavily weighted in favour of Python. The more complicated the operation to be executed and the larger the dataset (this is just 1000 integers) the more any comparison will favour in-dataframe operations over looping. And there aren't a lot of things where you can bear to get a few hundred times slower.
Avoid UDFs
The next thing people try when told not to loop are UDFs - user defined functions. Again, in Pandas, these are pieces of Python code and the only difference is that the dataframe runs the code itself. An example:
import timeit
import pandas as pd
import numpy as np

def apply_add_one(df):
    def add_one(a):
        return a + 1
    df = df.apply(add_one)

df = pd.DataFrame({"a": np.random.rand(1000)})

print("apply takes: %f secs" % timeit.timeit("apply_add_one(df)", globals=globals(), number=100))
Which prints:
apply takes: 0.013365 secs
So yes, in this case, a UDF is lot faster than looping, though still considerably slower - nearly twice - than using pandas operations directly. User-defined functions aren't always even so performant as this - the slowdown can be particularly bad in lazily evaluted dataframe libraries because UDFs make life hard for the query optimiser.
It's operative to leave the data in the dataframe: don't keep pulling it out to work on it in your programming language. Use the built-in dataframe functions: they are a lot more effective.
Smaller is better
There is a certain glamour to working on some enormous dataset: you get to tell everyone else that you're working on "Big Data". But much "Big" data is less big than bloated: filled with repetition, values that use a bigger representation than necessary, pre-normalised, accidentally cartesian, and so on. The list of ways to make medium-sized data into big data is long.
Representation matters a lot. An common example, especially where some of the
data has passed through excel, are booleans. Excel typically represents true
and false with the strings TRUE and FALSE, which often weigh 8 and 10 bytes
respectively (in UTF-16LE - which is what Excel outputs when you save to csv).
A boolean is ideally a single bit so the word FALSE is 80 times bigger than
necessary. Over a large number of rows the pain of bloated data representation
really mounts.
The same thing happens with integers. The default integer size in many tools is often 8 bytes wide (or 64 bits). That's a lot of extra bytes if your column is only going to be used to carry integers between 1 and 30. Usually there is a smaller integer size that is smaller, either two bytes or even a single byte - try to use that instead.
Some columns are de-facto enums - they only contain a fixed set of options.
E-commerce businesses often have a simple state machine for customer orders -
PICKING, PACKING, SHIPPING, COMPLETED etc. Putting these as strings
massively bloats out the column. A few libraries have support for
automatically changing the representation of these - for example Pandas
does - but in
other scenarios you can just map them to integers and use a small integer
column to store those.
All of these optimisations seem small individually: shaving one shaves off only a few bytes per row, but when you have a billion rows, each byte shaved off is 1 GB off the size of your dataset. It's not unusual to find a dataset that seems too big for memory only to discover that, after optimising it a little, that suddenly it fits into the memory of a well-specced desktop PC. Anything you do to shrink a dataset will make life easier.
Hint 4: Use csvbase.com
The final tip, because yes, this is an advert, is to: try csvbase.
csvbase is an open source website for sharing data. It makes it really easy to share data between people - everyone can export in their preferred format: data scientists get parquet, programmers get a REST API and those would take joy in MS Excel can get XLSX with properly formatted cells. And of course you can see your table in a web browser:
The REST API is pretty easy. For example, GET a row with curl:
curl https://csvbase.com/meripaterson/stock-exchanges/rows/227
You get:
{
  "row": {
    "Continent": "Western Europe",
    "Country": "United Kingdom",
    "Last changed": "2017-08-16",
    "MIC": "XLON",
    "Name": "London Stock Exchange"
  },
  "row_id": 227,
  "url": "https://csvbase.com/meripaterson/stock-exchanges/rows/227"
}
And you can get started as easily as pasting cells from excel:
I'm looking for ideas to improve it. If you have any, please write to me at cal@calpaterson.com.
The future of the past/past of the future
Why aren't dataframes more widely used, outside the data team? Perhaps one of the reasons is that there was never a time when they seemed new and hip. That early and trendy period is a crucial one that allows technologies to gain their advocates, and with them, its adoption.
Instead, many software engineers are suspicious that dataframes are largely a rebrand of the old, SQL, idea of "tables". That is roughly the truth - and SQL is old by the standards of computing. The original - and still central - ideas about relational data and normal form are dated 1970.
It seems reasonable that the solutions of the past would have solved their problems in the past. Not in this case: eight years ago some bright spark noticed that the relational model hadn't made it to the field of statistics, so he reworded part of it to help the statisticians better organise their data.
That became the tidyverse and has been massively influential and had a huge positive effect on data exchange, not just in statistics, but in many fields. The past is still here. It's just not evenly distributed.
See also
You can find more of my blogposts (of which only a small number are thinly veiled adverts such as this one) on my website: https://calpaterson.com. You can sign up to get an email when I write something new and there is an RSS feed as well.
If you want to get started with "dataframe-oriented programming" the best thing to do is to learn the pandas library and for that, the best place to begin reading is Chapter 5 of Python for Data Analysis.
If you want to learn SQL well, I always recommend C. J. Date's books, which I love but I realise that almost everyone else hates. Regardless, the best start on that front is SQL and Relational Theory.
I've written in the past about the dataframe libraries that certain big investment banks use. I still think those are good and I wish the banks would open source something for a change.
One of the things that makes dataframes popular is that SQL gets harder and harder to use as your program grows. My favourite article explaining the issues with SQL is Against SQL.