csvbase is a simple website for sharing table data. Join the discord.
My favourite API is a zipfile on the European Central Bank's website
Simple data pipeline powertools: sqlite, pandas, gnuplot and friends
2023-09-13
by Cal Paterson
When was the Dollar highest against the Euro?
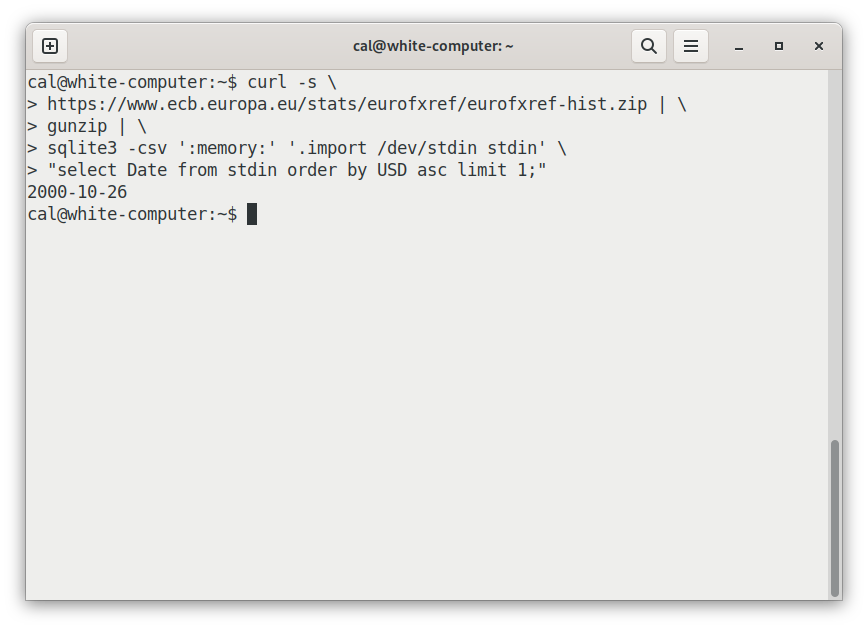
Here is a small program that calculates it:
curl -s https://www.ecb.europa.eu/stats/eurofxref/eurofxref-hist.zip \
| gunzip \
| sqlite3 ':memory:' '.import /dev/stdin stdin' \
  "select Date from stdin order by USD asc limit 1;"
The output: 2000-10-26. (Try running it yourself.)
How it works:
The curl bit downloads the official historical data that the European
Central Bank
publishes
on the position of the Euro against other currencies. (The -s flag just
removes some noise from standard error.)
That data comes as a zipfile, which gunzip will decompress. If you are
running on Mac OS or BSD, substitute bsdtar -xOf - for gunzip as
BSD-derived gunzip does not support zipfiles.
sqlite3 queries the csv inside. :memory tells sqlite to use an in-memory
file. After that, .import /dev/stdin stdin tells sqlite to load standard
input into a table called stdin. The string that follows that is a SQL
query.
Cleanup in column 42
Although pulling out a simple max is easy, the data shape is not ideal. It's
in "wide" format - a Date column, and then an extra column for every
currency. Here's the csv header for that file:
Date,USD,JPY,BGN,CYP,CZK,DKK,EEK,GBP,HUF,LTL,LVL,MTL,[and on, and on]
When doing filters and aggregations, life is easier if the data is in "long" format, like this:
Date,Currency,Rate
Switching from wide to long is a simple operation, commonly called a "melt". Unfortunately, it's not available in SQL.
No matter, you can melt with pandas:
curl -s https://www.ecb.europa.eu/stats/eurofxref/eurofxref-hist.zip | \
gunzip | \
python3 -c 'import sys, pandas as pd
pd.read_csv(sys.stdin).melt("Date").to_csv(sys.stdout, index=False)'
There is one more problem. The file mungers at ECB have wrongly put a trailing comma at the end of every line. The makes csv parsers pick up an extra, blank column at the end. Our sqlite query didn't notice, but these commas interfere with the melt, creating a whole set of junk rows at the end:
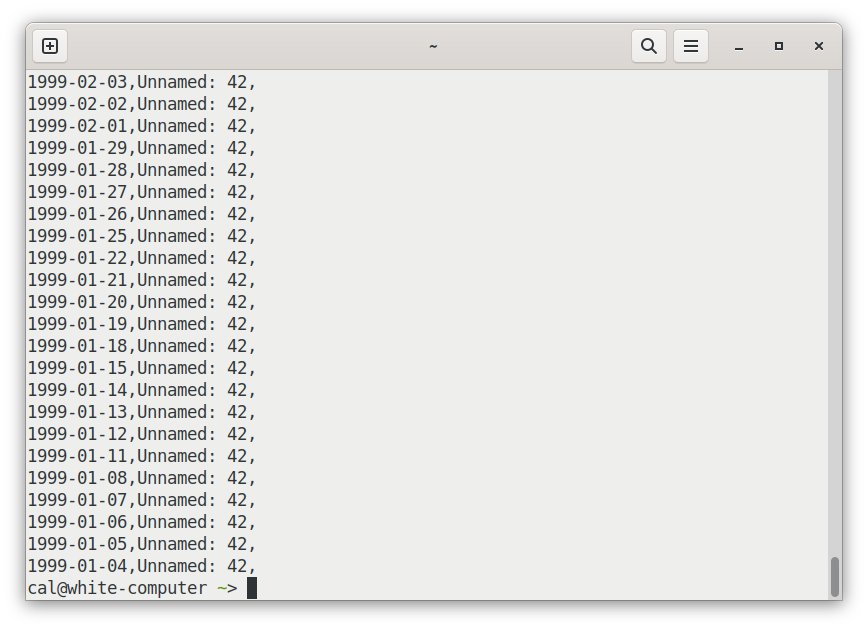
The effects of that extra comma can be removed via pandas by adding one more
thing to our method chain: .iloc[:, :-1], which effectively says "give me all
rows (":") and all but the last column (":-1"). So:
curl -s https://www.ecb.europa.eu/stats/eurofxref/eurofxref-hist.zip | \
gunzip | \
python3 -c 'import sys, pandas as pd
pd.read_csv(sys.stdin).iloc[:, :-1].melt("Date")\
.to_csv(sys.stdout, index=False)'
Does everyone who uses this file have to repeat this data shitwork?
Tragically, the answer is yes. As they say: "data janitor: nobody's dream, everyone's job".
In full fairness, though, the ECB foreign exchange data is probably in the top 10% of all open data releases. Usually, getting viable tabular data out of someone is a much more tortuous and involved process.
Some things we didn't have to do in this case: negotiate access (for example by paying money or talking to a salesman); deposit our email address/company name/job title into someone's database of qualified leads, observe any quota; authenticate (often a substantial side-quest of its own), read any API docs at all or deal with any issues more serious than basic formatting and shape.
So eurofxref-hist.zip is, relatively speaking, pretty nice actually.
But anyway - I'll put my cleaned up copy into a csvbase table so you, dear reader, can skip the tedium and just have fun.
Here's how I do that:
curl -s https://www.ecb.europa.eu/stats/eurofxref/eurofxref-hist.zip | \
gunzip | \
python3 -c 'import sys, pandas as pd
pd.read_csv(sys.stdin).iloc[:, :-1].melt("Date")\
.to_csv(sys.stdout, index=False)' | \
# this is the new bit: \
curl -n --upload-file - \
'https://csvbase.com/calpaterson/eurofxref-hist?public=yes'
All I've done is add another curl, to HTTP PUT the csv file into csvbase.
--upload-file - uploads from standard input to the given url (via HTTP PUT).
If the table doesn't already exist in csvbase, it is created. -n adds my
credentials
from my ~/.netrc. That's it. Simples.
Drawing pretty graphs
Alright, now the data cleaning phase is over, let's do some more interesting stuff.
Let's graph the data:
curl -s https://csvbase.com/calpaterson/eurofxref-hist | \
grep USD | \
cut -d, -f 2,4 | \
gnuplot -e "set datafile separator ','; set term dumb; \
plot '-' using 1:2 with lines title 'usd'"
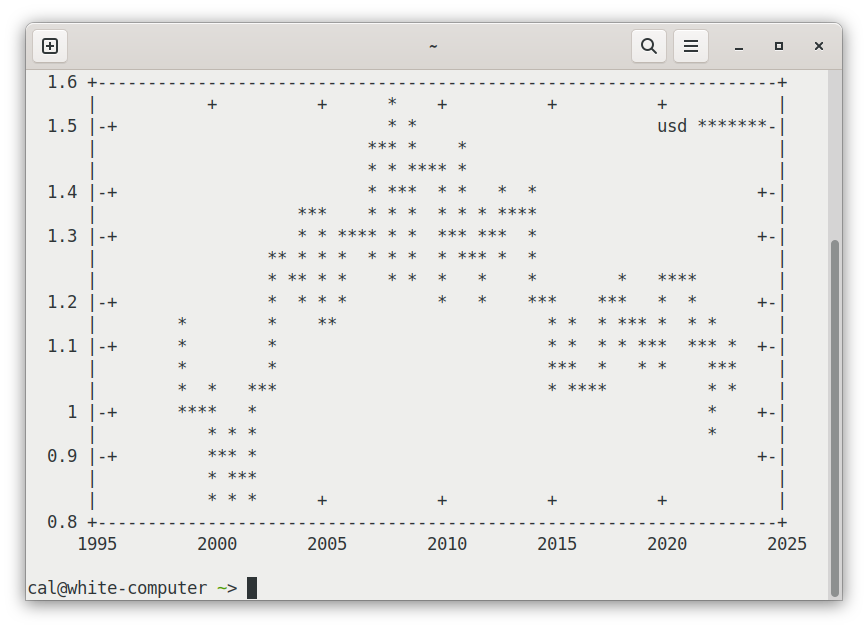
That's somewhat legible for over 6000 datapoints in an 80x25 character terminal. You can make out the broad trend. A reasonable data-ink ratio.
(If you're wondering how https://csvbase.com/calpaterson/eurofxref-hist returns a webpage to your browser but a csv file to curl, see an earlier blogpost.)
gnuplot is like a little mini-programming language of it's own. Here's what
the above snippet does:
set datafile separator ','- says it's a csvset term dumb- draw ascii-art!plot -plot the data coming from standard inputusing 1:2 with linesdraw lines from columns 1 and 2 (the date and the rate respectively)title 'usd'name the line
You can, of course, also draw graphs to proper images:
curl -s https://csvbase.com/calpaterson/eurofxref-hist | \
grep USD | \
cut -d, -f 2,4 | \
gnuplot -e "set datafile separator ','; set term svg; \
set output 'usd.svg'; set xdata time; set timefmt '%Y-%m-%d'; \
set format x '%Y-%m-%d'; set xtics rotate; \
plot '-' using 1:2 with lines title 'usd'"

Outputting to SVG is only a bit more complicated than ascii art. In order for it look decent you need to help gnuplot understand that it's "timeseries" data - ie: that the x axis is time; give a format for that time and then tell it to rotate the markings on the x axis so that they are readable. It's a bit wordy though: let's bind it to bash function so we can reuse it:
plot_timeseries_to_svg () {
    # $1 is the first param
    gnuplot -e "set datafile separator ','; set term svg; \
    set output '$1.svg'; set xdata time; set timefmt '%Y-%m-%d'; \
    set format x '%Y-%m-%d'; set xtics rotate; \
    plot '-' using 1:2 with lines title '$1'"
}
Rolling averages and new tools
So far, so good. But it would be nice to try out more sophisticated analyses: let's try putting a nice rolling average in so that we can see a trend line:
curl -s https://csvbase.com/calpaterson/eurofxref-hist | \
duckdb -csv -c "select Date, avg(value) over \
(order by date rows between 100 preceding and current row) \
as rolling from read_csv_auto('/dev/stdin')
where variable = 'USD';" | \
plot_timeseries_to_svg rolling

Smooth. If you don't have duckdb installed, it's not hard to adapt the above
for sqlite3 (the query is the same). DuckDB is a tool I wanted to show
because it's a lot like sqlite but instead is columnar (rather than
row-oriented). However for me the main value is that it has a lot of easy
ergonomics.
Here is one of them: you can load csvs into table files straight from HTTP:
-- it works with csvbase!
CREATE TABLE eurofxref_hist AS SELECT * FROM
read_csv_auto("https://csvbase.com/calpaterson/eurofxref-hist");
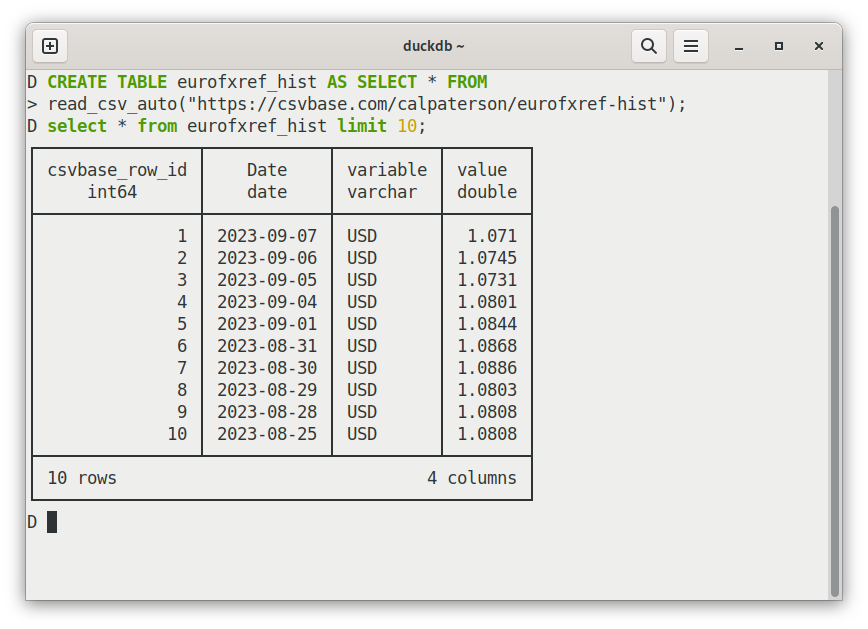
That's pretty easy, and DuckDB does a reasonable job of inferring types. There are a lot of other usability niceties too: for example, it helpfully detects your terminal size and abridges tables by default rather than flooding your terminal with an enormous resultset. It has a progress bar for big queries! It can output markdown tables! Etc!
Open data is also an open API
A lot is possible with a zipfile of data and just the programs that are either
already installed or a quick brew install/apt install away. I remember how
impressed I was when I was first shown this eurofxref-hist.zip by an old hand
from foreign exchange when I worked in a bank. It was so simple: the simplest
cross-organisation data interchange protocol I had then seen (and probably
since).
A mere zipfile with a csv in it seems so diminutive, but in fact an enormous mass of financial applications use this particular zipfile every day. I'm pretty sure that's why they've left those commas in - if they removed them now they'd break a lot of code.
When open data is made really easily available, it also functions double duty as an open API. After all, for the largeish fraction of APIs in which are less about calling remote functions than about exchanging data, what is the functional difference?
So I think the ECB's zipfile is a pretty good starting point for a data interchange format. I love the simplicity - and I've tried to keep that with csvbase.
In csvbase, every table has a single url, following the form:
https://csvbase.com/<username>/<table_name>
eg
https://csvbase.com/calpaterson/eurofxref-hist
And on each url, there are four main verbs:
When you GET: you get a csv (or a web page, if you're in a
browser).
When you PUT a new csv: you create a new table, or overwrite the existing one.
When you POST a new csv: you bulk add more rows to an existing table.
When you DELETE: that table is no more.
To authenticate, just use HTTP Basic Auth.
Could it be any simpler? If you can think of a way: write me an email.
Notes
I said above that most SQL databases don't have a "melt" operation. The ones that I know of that do are Snowflake and MS SQL Server. One question that SQL-knowers frequently ask is: why does anyone use R or Pandas at all when SQL already exists? A key reason is that R and Pandas are very strong on data cleanup.
One under-appreciated feature of bash pipelines is that they are multi-process. Each program runs independently, in it's own process. While curl is downloading data from the web, grep is filtering it, sqlite is querying it and perhaps curl is uploading it again, etc. All in parallel, which can, surprisingly, make it very competitive with fancy cloud alternatives.
Why was the Euro so weak back in 2000? It was launched, without coins or
notes, in January 1999. The Euro was, initially, a sort of in-game currency
for the European Union. It existed only inside banks - so there were no notes
or coins for it. That all came later. So did belief - early on it didn't look
like the little Euro was going to make it: so the rate against the Dollar was
0.8252. That means that in October 2000, a Dollar would buy you 1.21 Euros (to
reverse exchange rates, do 1/rate). Nowadays the Euro is much stronger: a
Dollar would buy you less than 1 Euro.
Many thanks to Filip Chabik who provided improved versions of many of the code samples that are cross platform (working on BSD-derived unixen too).